


As I wrote earlier this year, most states impose at least minimal testing and accountability requirements on public schools. Thanks in part to federal law, every state tests public school students in reading and math in grades 3-8 and publishes the results. Anyone can go to a state report card or GreatSchools and get at least some sense of how a public school is doing.
But many states have forgotten about these minimal safeguards when it comes to private school choice programs. Most states with private school choice programs don’t require students to take any tests, let alone the same ones required by public school students.1
Iowa is an interesting exception to that rule. Thanks to its annual Condition of Education report, we can actually ask a basic question that is surprisingly hard to answer elsewhere: How are students participating in the state’s Education Savings Account (ESA) program doing academically? Here’s what we can say so far:
Iowa’s ESA program is mostly serving wealthier students
The number of Iowa’s ESA students who took the state tests doubled between 2023-24 and 2024-25, from about 8,000 to nearly 16,500. Most demographic groups grew right along with that, but low-income students didn’t. In fact, the number of ESA recipients eligible for free or reduced-price lunch actually fell, from about 2,400 to slightly over 1,800, even as the overall program doubled in size. As a result, low-income students went from 30% of all ESA recipients in year one to just 11% in year two.
This is partly due to how Iowa phased in eligibility. In year one, students who were continuing in their private schools faced an income cap of 300% of the poverty line. In year two, that line rose to 400%. Meanwhile, new-to-nonpublic-school students and kindergartners never faced an income cap. With the income cap disappearing entirely this year, Iowa’s program is likely to become even more heavily tilted toward wealthier families.
Proficiency and growth rates look pretty solid, even for disadvantaged groups
In Iowa, ESA students outperform their public school peers on the state ISASP test. In math, 79% of ESA students scored proficient or better, compared to 70% for all students statewide. Among ESA participants, every subgroup outperformed the statewide average for that same group. For example, 70% of low-income ESA participants passed the math test compared to 54% of low-income students statewide.
While proficiency numbers are encouraging, they don’t tell us much about the effects of the program. ESA students could simply have started out ahead. The annual growth data are therefore more revealing.
Iowa calculates Student Growth Percentiles for ESA program recipients. As Iowa explains it, “a student growth percentile (SGP) describes a student’s growth compared to other students with similar prior test scores (their academic peers).” Across all students statewide, the median SGP is 50.
The graph below shows the SGP math scores for Iowa’s ESA participants. Across all ESA participants, the median math growth score was 49. That means Iowa’s ESA participants made about the same academic progress as all other Iowa students who started with similar prior test scores.
But particular groups of students made slightly more progress with the ESA. Low-income students and students with disabilities who received an ESA all made slightly more progress in math than their peer groups across the state. English Learners were the exception, and they made slightly less progress in the ESA program.
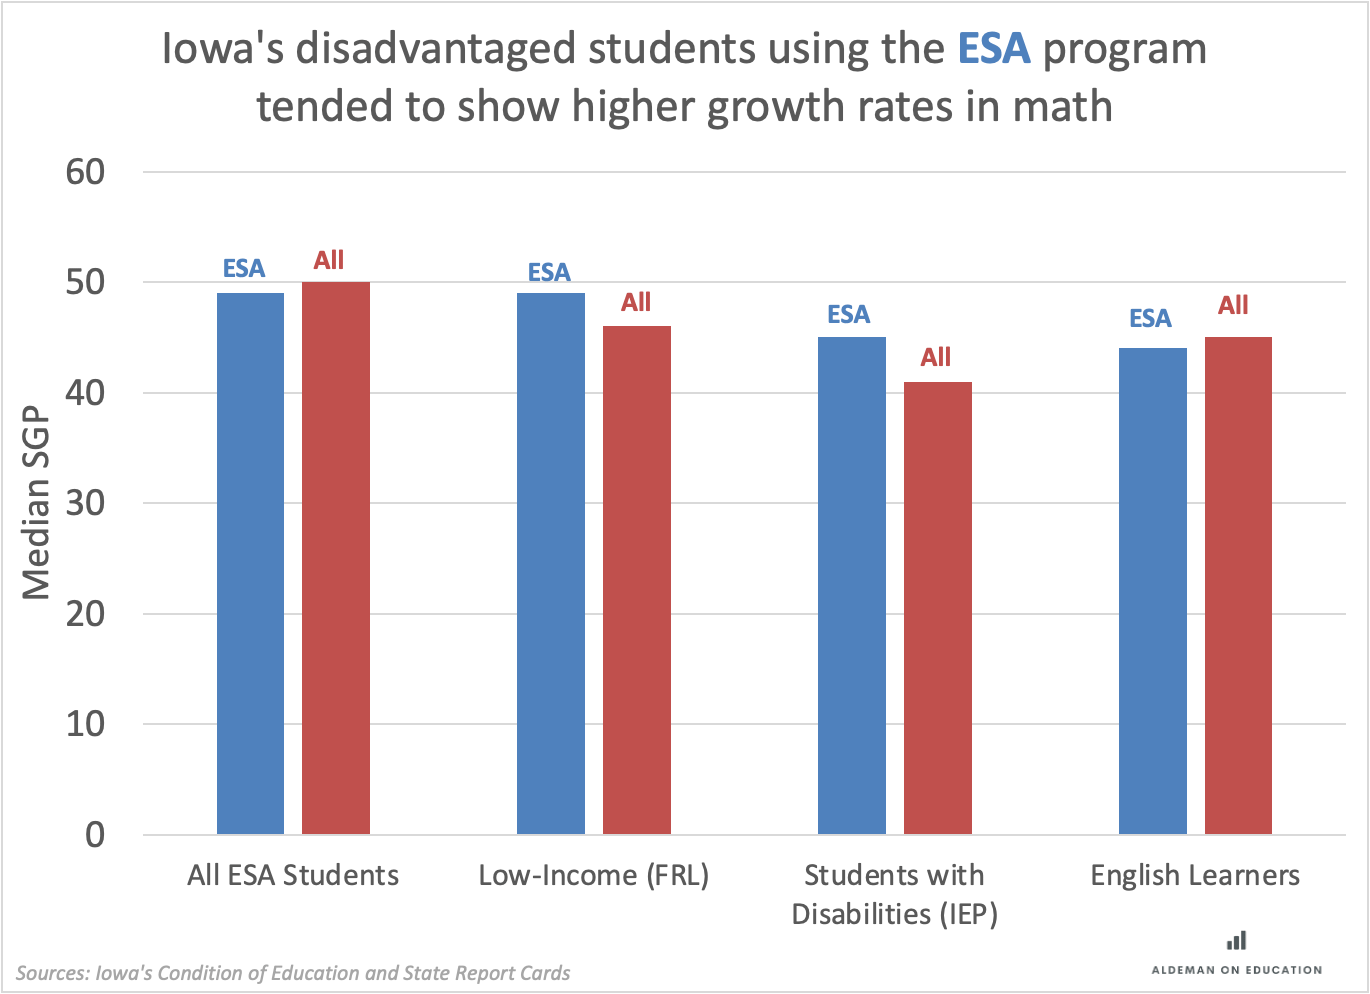
The results were similar across race/ ethnicities. In math, White, Hispanic, and Asian students all slightly underperformed with the ESA, while Black ESA recipients did slightly better. The results were also similar in English Language Arts, with slightly faster growth among Black students, English Learners, and students with disabilities, and slightly slower growth among Asian and White students. These are all small differences, and I wouldn’t make too much of them. The broader pattern is much clearer: ESA students appear to be making typical academic progress. There’s little evidence here of either a dramatic private-school advantage or an academic collapse.
The bottom line for Iowa’s taxpayers
Of course, none of this tells us that Iowa’s ESA program caused those differences. Families had to opt in, and it’s likely that ESA families differ from non-applicants in ways that predict test scores independent of which school a kid attends. Per the enrollment numbers above, that selection story probably got a bit stronger this year, not weaker, as the pool of participants has skewed further away from low-income families.
However, Iowa remains the exception, not the rule, among states running private school choice programs. In exchange for over $8,100 in state funds, Iowa’s ESA students have to take the same state tests as public school students do. Then, the state tracks that data and reports both proficiency levels and year-over-year growth rates. As a result, Iowa’s taxpayers can at least be confident its ESA program participants are making roughly comparable progress in reading and math. Most states with private school choice programs can’t make that claim, but Iowa can.
Families are still left in the dark
While Iowa policymakers have more information than their peers in other states, Iowa’s families don’t really benefit from that deal. Iowa doesn’t publish school-level results for ESA participants, so good luck to any parent trying to figure out which private schools are actually delivering strong results.
This is a real blind spot for schools-as-markets reformers. The theory behind school choice is that families can use information about quality to make better choices, rewarding effective schools and putting pressure on weaker ones.
But markets depend on information to function properly. Iowa has done more than most states to find out whether ESA students are learning. The next step should be letting parents know which schools are actually doing the best job of teaching them.
Reading List
Colleston Morgan: Education Was on the Ballot in Wisconsin. And the Message Was Clear.
Future Ed: How Deborah Gist Is Helping Public Schools Tap Into Federal Tax Credit Scholarships
Nevada Independent: Trump’s school choice tax credit has an unexpected ally: Clark County public schools
Chalkbeat: NYC missed opportunity with $8,500 bonuses for teachers with large classes
In an embarrassing recent example, The Tennessean reported that just 17% of the Volunteer State’s voucher recipients scored proficient in math. And this will be the last year of testing. Earlier this spring the state legislature ended its state testing requirement going forward. Nothing to see here, folks!