

Three Charts
NAEP scores, school staffing, + public spaces

You might be tired of reading about the national NAEP scores, but I’m going to try to tempt you with one more analysis…
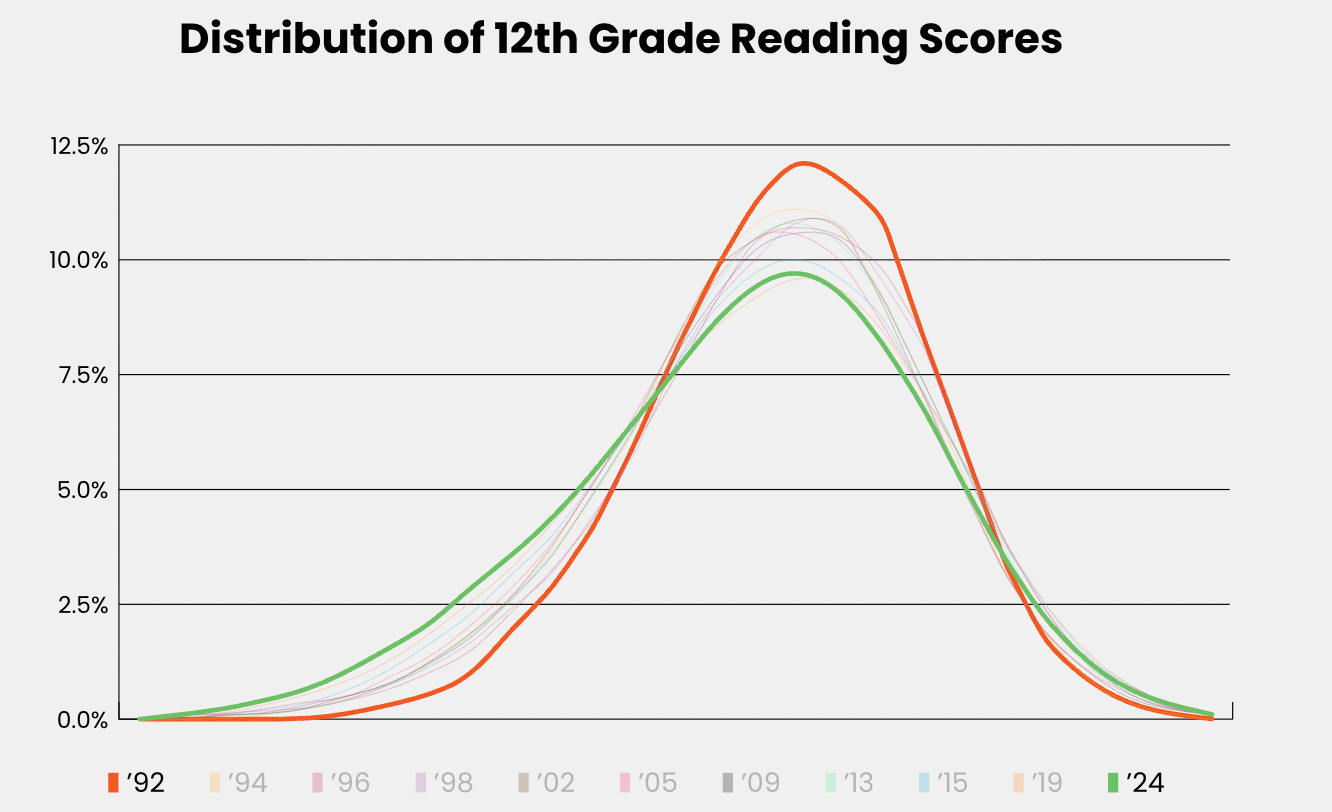
Namely, I worked with The 74 to show how NAEP scores have changed over time. Not just the averages, but how has the full distribution shifted over time? We should all want to see the curve shift to the right, as more students score at higher performance levels.
The graph below for 12th grade reading is the most depressing. It compares the 1992 distribution (in red) versus the one from 2024 (in green). Early coverage of the results focused on the averages or the fact that there were more lower-performing students. But the visual really hits this home. As you can see starting from left to right, there are a LOT more kids scoring at the lower end of the distribution, there are fewer kids in the middle bands, and there are slightly more high-scoring students.
Over at The 74, you can see how the reading and math scores evolved year-by-year. We chose to focus on the latest 12th grade scores, but you could copy our methodology for other subjects or states.
What to make of the decline and divergence? I’ve written about that in other places, but I suspect it could be a combination of societal factors like the decline in reading for fun and the increase in immigration over this time period, as well as school-based factors like classroom instruction and the decline in basic skills.
More on staffing
By now you know that school staffing levels are up across the country. But the Edunomics Lab team has a cool new tool to let you see what those look like in your community. You can look up your state or district.
Here’s Virginia. Since 2018-19, its schools have 13% more full-time equivalent employees (FTEs), with notably large increases in paraprofessionals and district administration. Meanwhile, student enrollments are down 2%.
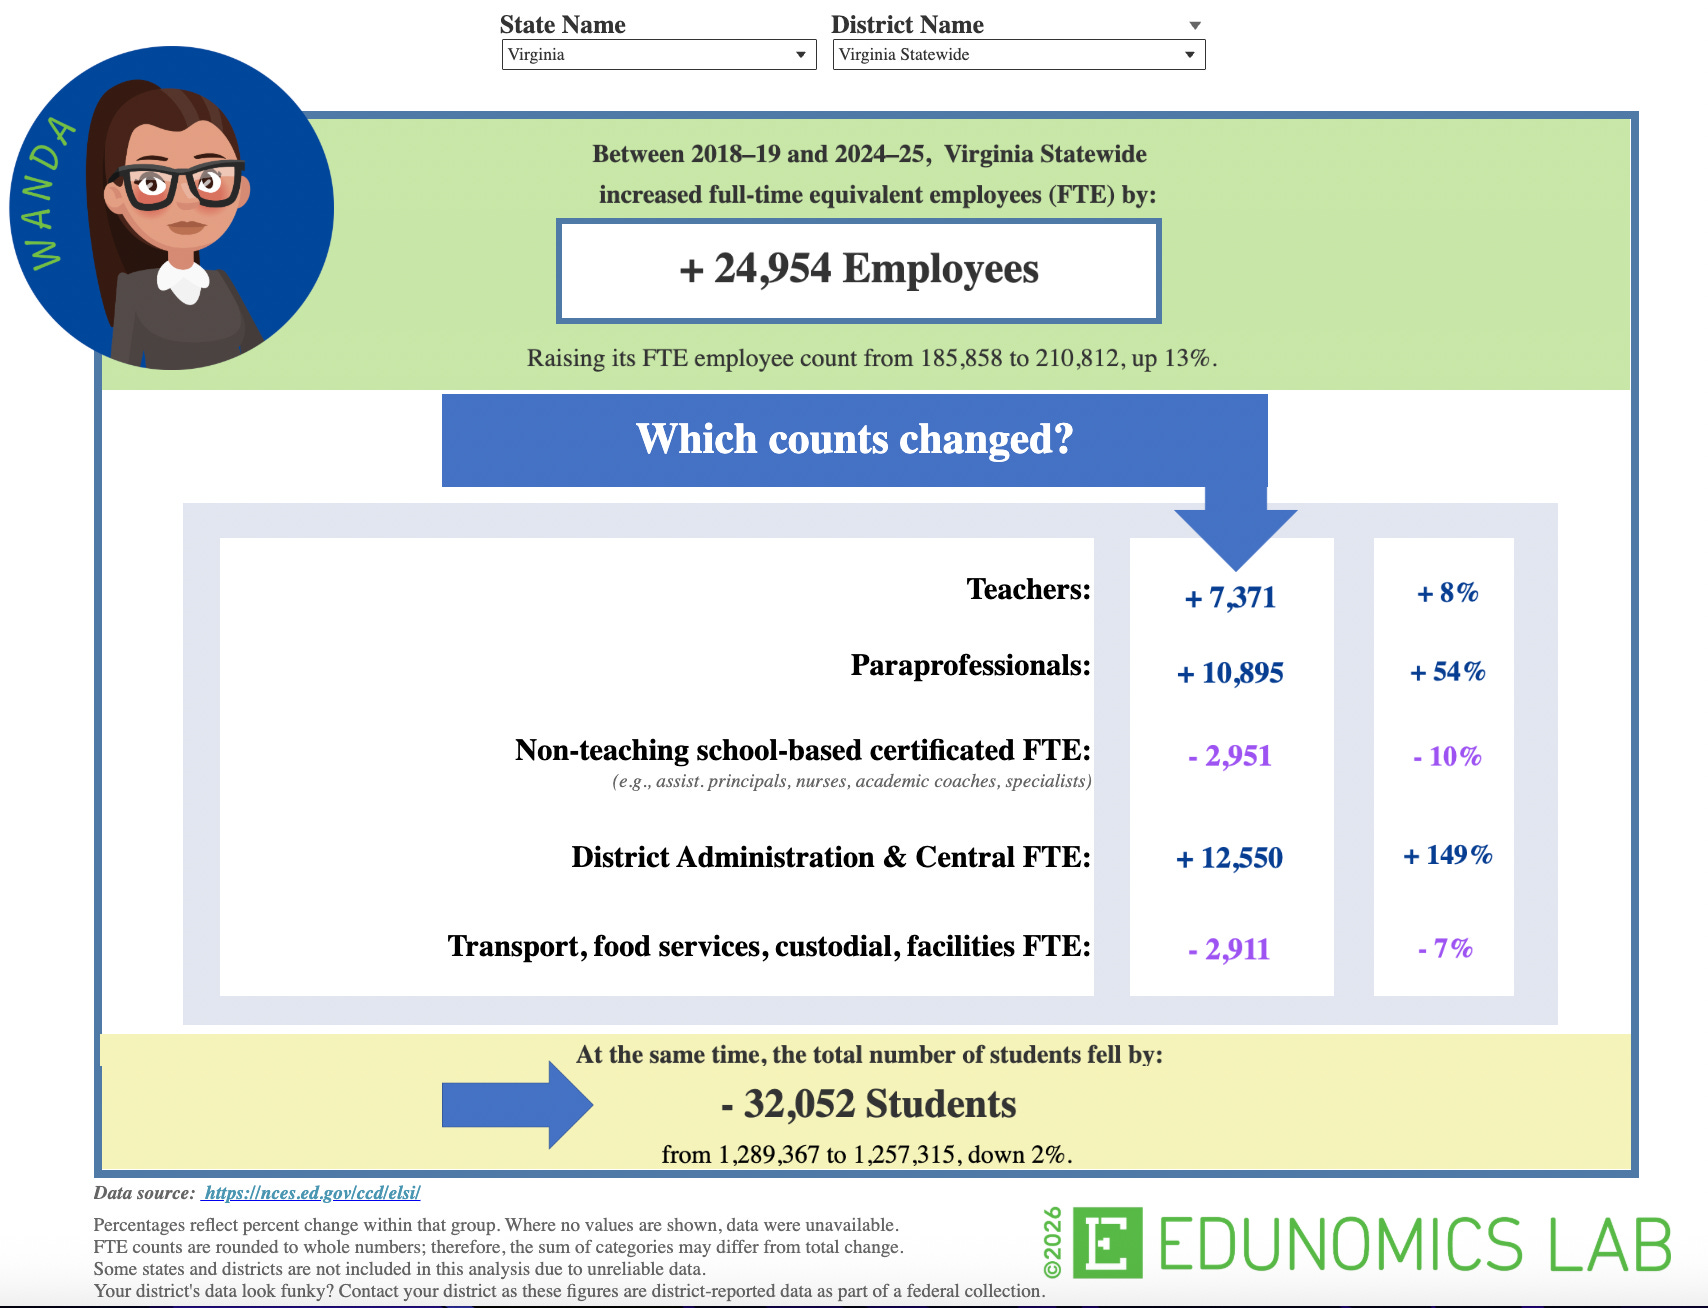
Go check it out!
Fixing public spaces?
Noah Smith had a recent piece about the Bay Area Rapid Transit system (BART). Ridership is way down since COVID, and the riders who remained complained about safety and general disorder on the trains. But when BART installed new entry gates that deterred people from entering the stations without paying, crime plummeted by 54%.
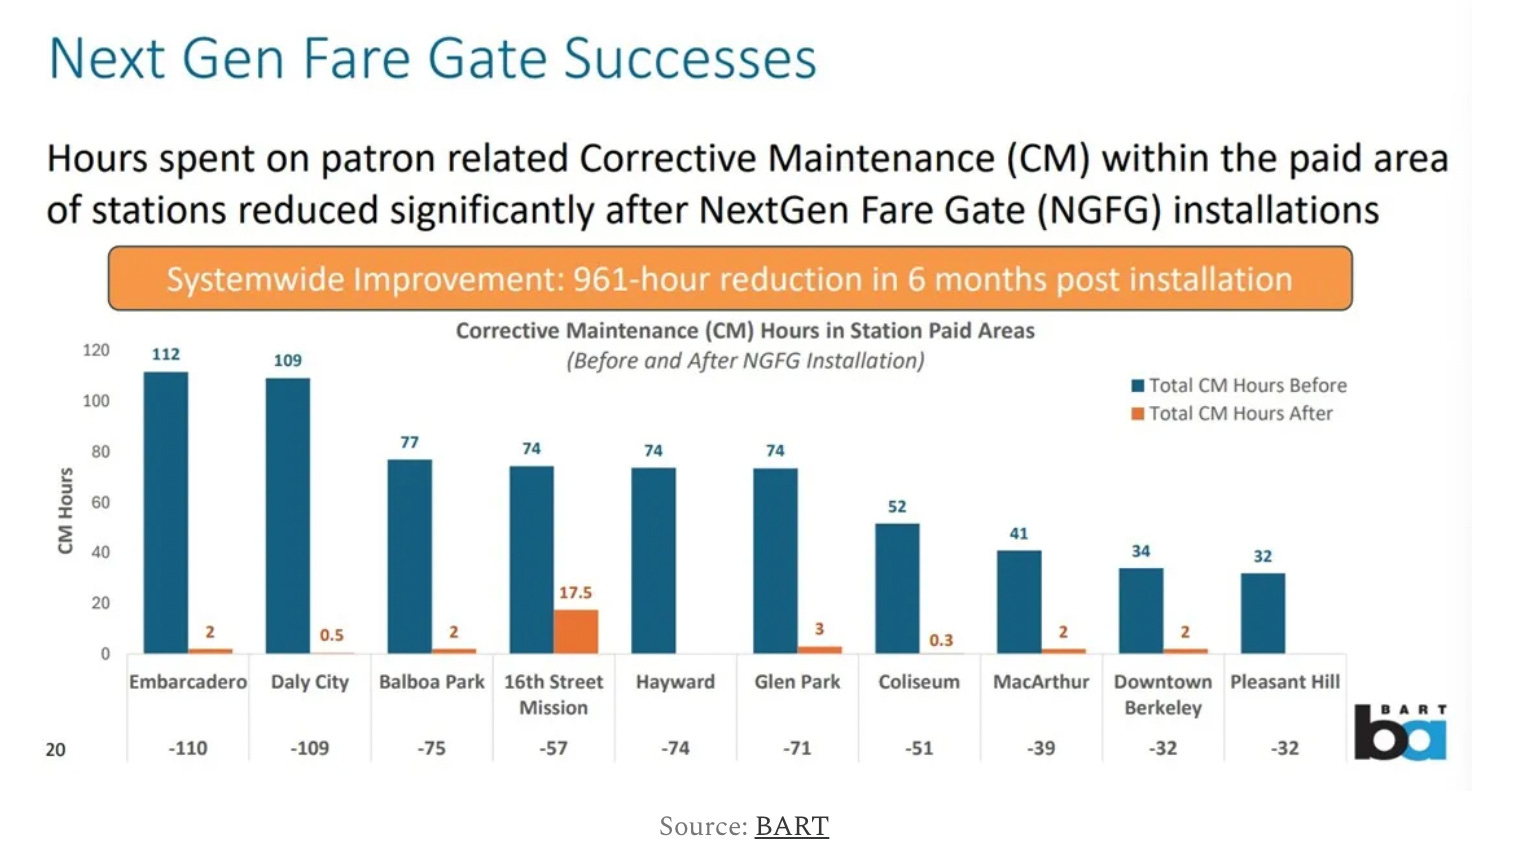
Not only that, but BART employees suddenly had a lot fewer maintenance problems. The chart below shows the number of hours, by station, that employees were spending on corrective maintenance tasks like fixing or cleaning up things that riders break or mar in some way. As you can see, cracking down on fare evasion cleaned up a lot of problems and saved BART employees a lot of time!
What’s the education equivalent? Teachers I know have been complaining a lot about fights and general campus disorder. Public school systems have an obligation to serve everybody, but how do they make sure their buildings are safe and orderly and true spaces for learning?
Here’s Smith on his takeaways:
Progressives often argue against measures like fare gates, labeling them “carceral” and “racist”. This demonstrates a principle that I call anarchyfare — the idea that eliminating society’s rules serves as a kind of welfare benefit for marginalized people. But in fact, most poor and marginalized people are just peace-loving people who need to ride the train to get to work. They are the chief victims of the tiny number of chaotic individuals who destroy the commons and make public spaces and public services unusable.
BART’s lesson should be applied throughout much of our society. Restraining a very few uncontrollable and chaotic individuals makes life much better for the poor and working class.
Safety versus independence
A couple people reached out after my recent piece about parenting decisions and the balance between safety and independence. Let me add that whether I would be happy letting a 6-year-old disappear for a few hours on his bike depends on a lot of factors. Mainly I’m opposed to strict, age-based rules as opposed to thinking through potential risks and what my child may or may not be ready for. In this case, are they steady on their bikes and comfortable navigating traffic situations? Do we have friends in the neighborhood? In general, do they usually make good decisions or do they often take unnecessary risks?
Lenore Skenazy has more on this case and the broader lessons.
Reading List
Jill Barshay: Grade inflation’s hidden damage
The 74 interview: Colorado Gov. Jared Polis on Why He’s Taking Trump’s ‘Free Money’
Nat Malkus: Progress on Absenteeism Is Stalling. What Can We Do About It?
Debbie Meyer: Changing a font is simple. Teaching children to read using systematic, explicit instruction is not.