

Which States *Actually* Have the Best Schools?
Unpack the compositional effects and the "winners" change

Note: After this blog ran, Matt Chingos from The Urban Institute reached out to clarify more about their methodology, and I realized I had made a mistake in my original calculations and graph. Most notably, the scores for Massachusetts look much better after this correction. What follows is revised, corrected text as of 1/28/25.
Everyone knows Massachusetts has the best schools in the country, right? After all, their students get the highest scores on NAEP, the Nation’s Report Card.
That’s how most people would evaluate a state’s school system. But Massachusetts is the third-richest state in the country, after DC and New York. It’s also more racially homogeneous than the average state, and relatively few of its students are non-native English speakers.
Could these advantages make Massachusetts look better than it really is?
The Urban Institute’s Matt Chingos recently ran the numbers for every state based on their 2022 NAEP results. He controlled for student demographics including gender, age, race or ethnicity, receipt of free and reduced-price lunch, special education status, and English language learner status, and then adjusted the scores accordingly. Across 4th and 8th grade math and reading Massachusetts still came in first among all the states
But I took it one step farther to find out which states did better or worse after controlling for demographics. I focused on 8th grade math. And on that metric, Massachusetts still came out on top, but a surprising group of states joined it, including Texas, Mississippi, Indiana, Louisiana, and Georgia. Some of these states may not have impressive scores overall, but they are outperforming what might be “predicted” for them based on their student demographics alone.
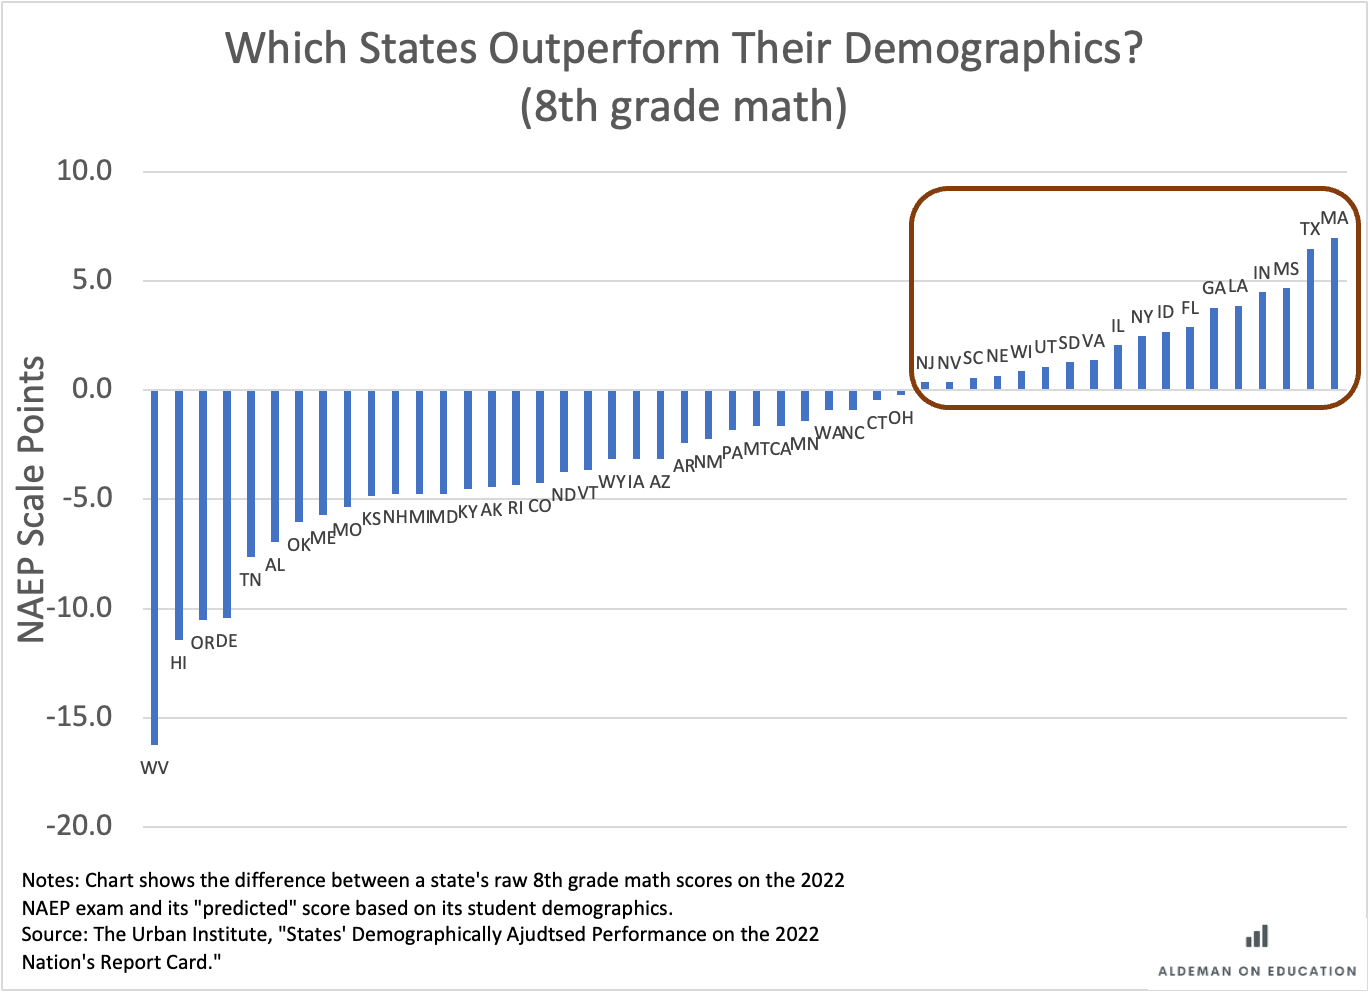
In contrast, other states look particularly bad on this metric. West Virginia students put up low scores overall, and the state does serves a relatively disadvantaged student body. But it comes in far below its “predicted” score based on demographics alone. Hawaii, Delaware, and Oregon also show up as far under-performing what might be expected of them based on their student demographics.
This analysis requires more work than a simple eye-ball comparison of raw averages, but it gives a more accurate sense of what each state’s schools are contributing to student learning.
The Urban Institute calculations consider every form of disadvantage that the NAEP tests currently measure. But it’s also possible to do this sort of analysis and focus on just a single metric.
For example, would you rather send your child to school in Texas or Wisconsin?
At first glance, that seems like an easy choice. Compared to Texas, Wisconsin spends a lot more money on education, its schools have lower staffing ratios, and its teachers have more training. In 8th grade math, Wisconsin ranks 5th while Texas comes in a distant 25th.
But as we’ve already discussed, the overall averages can be deceiving. White students in Wisconsin do perform better than White students in Texas, but Texas has a slight edge for Hispanic students and a huge advantage for Black students.
In fact, outside of Washington, DC, Wisconsin has the largest achievement gap between Black and White students. As a result, Texas scores #1 in the nation for Black students while Wisconsin comes in last. In numeric terms, Black students in Texas score 23 (!) points higher than Black students in Wisconsin.
So the next time you hear someone talk about which state has the best schools, ask them what they mean. Are they talking about the schools, or the students who happen to go to them?
I am wondering if this tool is available for individual school district to analyze their metrics? Thank you!
The did you select 8th grade math for your comparison? Is there a reason you think it’s a better metric than 4-8 math and reading?