

The Enrollment Roller Coaster
Monthly enrollment counts reveal a pattern most states never see

Every fall, schools count their students for funding purposes. But by the time spring arrives, many of those students are gone.
In most states, we don’t really have a way to know how enrollment changes across the school year. But because Washington state conducts monthly counts, and uses those counts to drive funding levels, we can get a sense of how this might be playing out in other places.
The chart below shows monthly K-12 enrollment in Washington from 2016 through the current school year. The pattern is remarkably consistent. Enrollment rises from September to October and then gradually declines throughout the rest of the school year. By May, districts are serving about 1% fewer students than they reported in October.
This year, that amounted to roughly 11,000 fewer students.
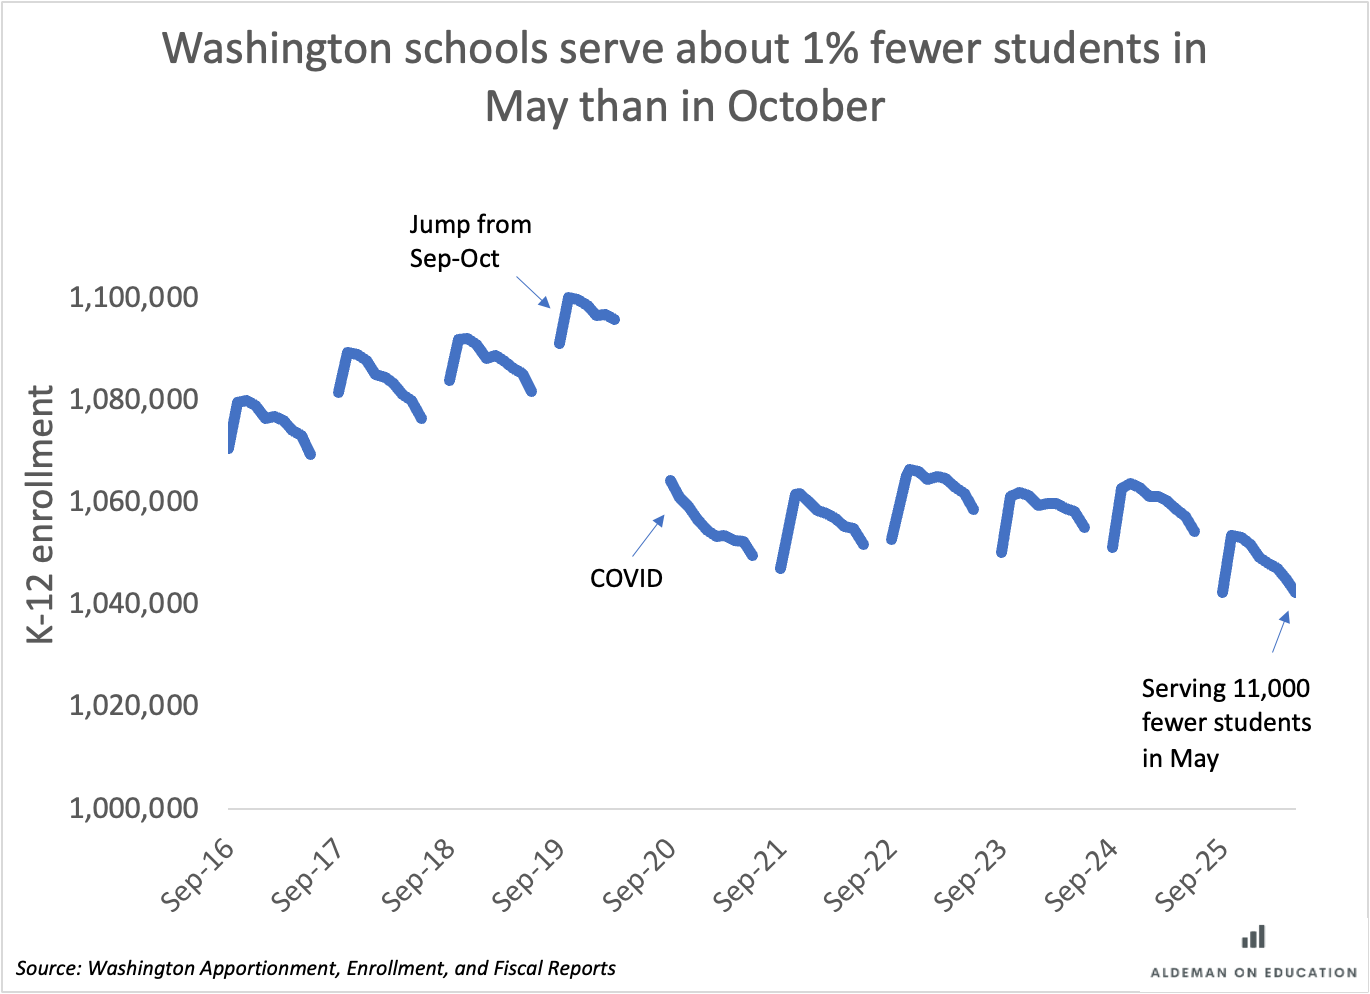
The COVID-19 pandemic disrupted overall enrollment levels, but it did not fundamentally change the within-year pattern. Before the pandemic and after it, Washington schools typically lost about 1% of their students between fall and spring.
Most states would never see this pattern. States that rely on a single fall count date may be funding schools based on enrollment levels that are higher than what districts serve for much of the school year. And, not only can Washington see these within-year patterns because they conduct monthly counts, the patterns may be smaller than they are in places with only a single fall count.
That matters for both state and local policymakers. If policymakers are basing funding and staffing models on October enrollment counts, it's a bit like designing a gym around the surge of new members who show up in January rather than the number who are still attending by spring.
The obvious question is what happens to these students. Given the rebound each fall, the graph likely reflects a combination of family mobility, transfers to private schools or homeschooling, and dropout and re-engagement patterns. States that rely on a single fall count may want to understand whether they experience similar within-year declines and how those patterns affect funding and staffing decisions.
Reading List
Jessika Harkay: A Delaware School Once Felt Like a ‘Prison.’ Now It’s a National Model
Anna Egalite: The Quiet Erosion of the Five-Day School Week
Kevin Mahnken: D.C. School Reforms Face Political Test
Jessica Baghian: “Accountability systems aren’t built for statisticians. They’re built for educators.”
The Mind Trust: Indy Summer Learning Labs Kicks Off Its Sixth Summer
Andrew Biggs: Social Security is not (just) a math or a political problem
The graph is a good example of how to lie with statistics, the y-axis would include zero and be scaled from o to 2 million in order to see the real magnitude of the changes in a year.