

Fewer women are becoming mothers
But history suggests things can change

Reading List
Student Achievement Is Down Overall — But Kids at the Bottom Are Sinking Faster
Are Kids Making Progress In Reading? It All Depends on How You Measure It
Why Are So Few Kids Reading for Pleasure?
Learn to Code! Wait, never mind…
Why are birth rates down?
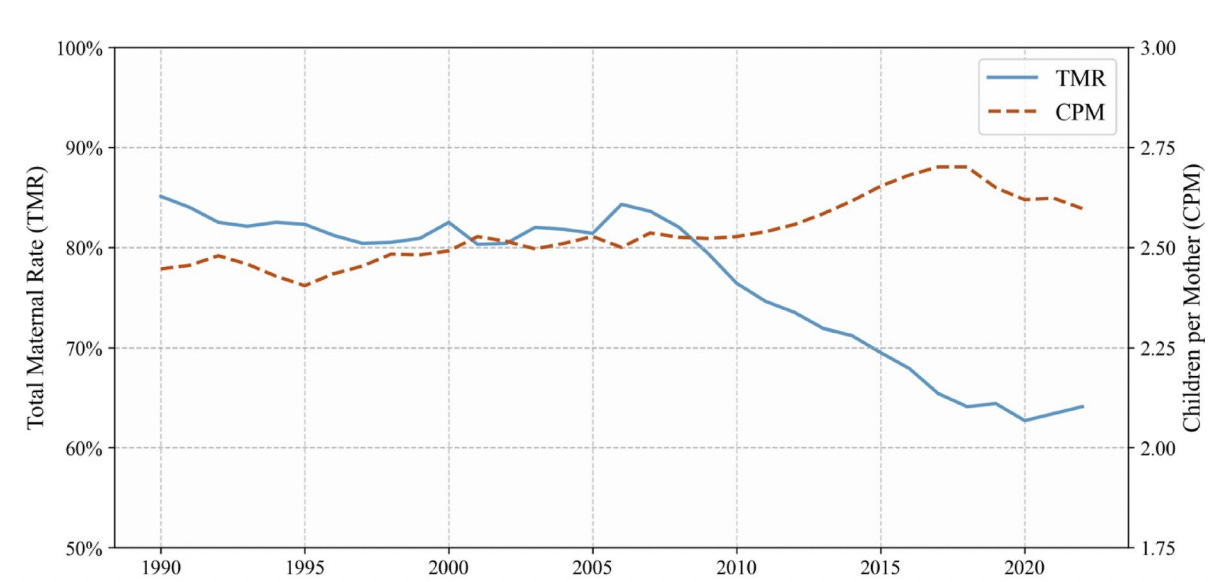
A recent paper in Nature helps us start to formulate an answer by breaking down fertility rates into two categories. The chart below shows the recent trends here in the U.S. The Total Maternity Rate (TMR, in blue) shows the percentage of women who become mothers over the course of their reproductive lifetime. The Children Per Mother (CPM, in red) shows the average number of children born to women who become mothers.
As you can see, the number of children per mother has remained fairly steady and is higher than it was throughout the 1990s and early 2000s. Meanwhile, the percentage of women who become mothers has fallen nearly 20 percentage points. To put it bluntly, the main driver of falling fertility numbers here in the U.S. is due to a smaller share of young women who ever have children.
How does the U.S. compare internationally? The U.S. is actually on the higher end of total fertility rates, and we’re particularly high on the children-per-mother metric. The only countries higher than us in terms of children-per-mother are smaller ones like Moldova, Guatemala, Panama, Kazakhstan, Israel, and the Philippines. Lots of countries have a higher childlessness rate and a lower family size than we do, including Canada, Italy, Spain, Greece, Russia, and China. Our childlessness rate is pretty similar to places like Germany, the U.K., Norway, Sweden, and Denmark, but we have larger families than those countries do. That’s doubly true in places like Japan and especially South Korea, which have substantially lower childlessness rates than we do, and smaller families.
But, as Claudia Goldin showed in a recent paper prepared for the Kansas City Fed, these trends can go both up or down. She flips the chart and looks at the percentage of women who are childless by age 40, and she separates out the results by the woman’s education level. As the graph below shows, the percentage of college-educated women with zero children by age 40 went from nearly 25% for those born in 1919, down to about 15% for those born in 1937, up to around 27% for those born in 1955, and then down, and then back up again. The line for non-college-educated women looks like a similar rollercoaster; going from 18% to 9% to 17% and then down and back up.
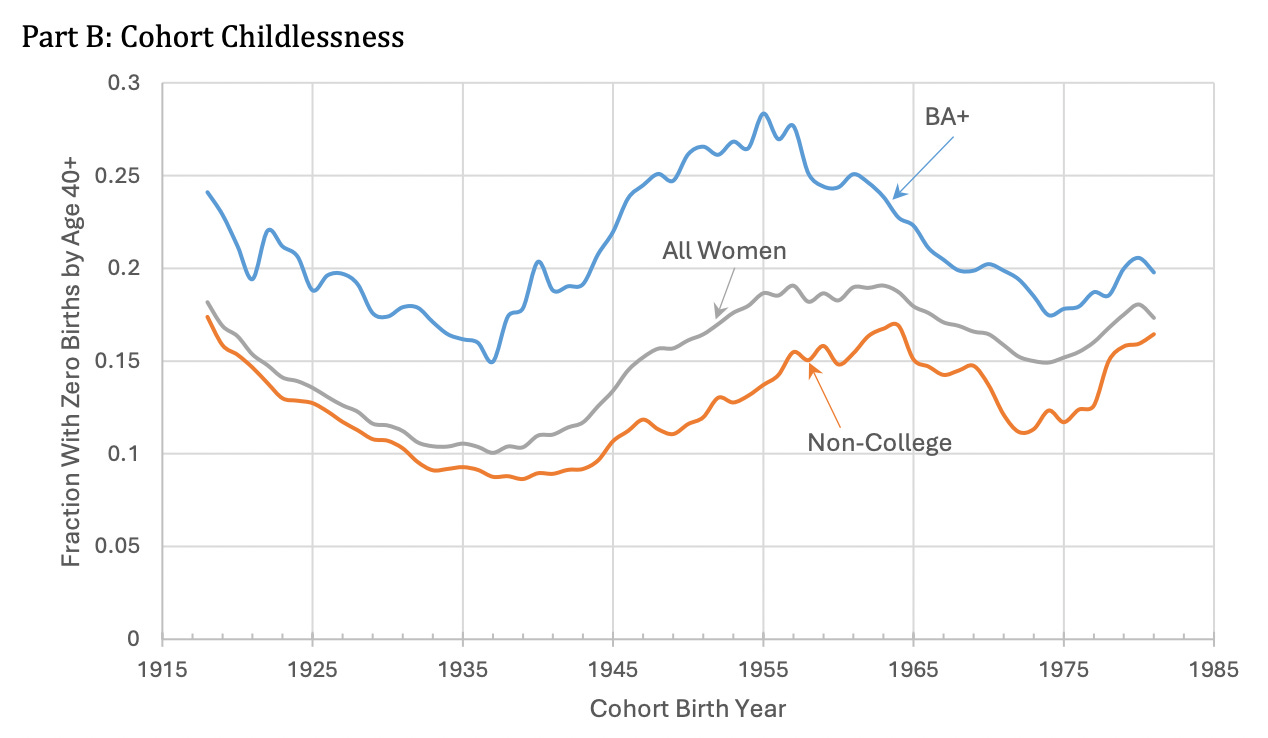
The other thing to note about Goldin’s graph is the difference between women who earned a college degree and those who did not. College-educated women have had higher childlessness rates for at least the last 100 years, but that gap is about as narrow today is it’s ever been. Here’s Goldin on the trends among college-educated women:
…college graduate women had a high rate of childlessness for cohorts born in the late 1950s. These women then made a remarkable turnaround, not by having children earlier in life. Rather, they were managing to have more children later in life due largely to advances in reproductive technology.
I find this all helpful to know. To me, it suggests that car seat regulations or child care expenses are not the main cause of the current fall in birth rates. It’s not the cost(s) of parenting.
Instead, there’s likely something cultural at play here that’s leading women to put off getting married and having children or just deciding motherhood is not for them. These may feel like permanent trends at the moment, but they could reverse if new technologies come along or if society’s cultural norms change.
Speaking of society’s cultural norms… I find the headline here equal parts interesting and infuriating. “Fewer women are becoming mothers.”
Maybe this article is alluding to the fact that women are more empowered to be the primary decision makers when it comes to having children. However, after reading, I’m left more with this sense of blame - that declining birth rates are the fault of educated women.
The way this article completely ignores the fact that a certain percentage of women deliberately chose not to have kids doesn't sit well with me.