Education Jobs Update, summer 2023
Education is a (very) seasonal industry
I had a new piece out at The 74 last week looking at the education labor market over the course of the first half of 2023. You should go read that piece if you want to understand the latest job trends in education.
But I thought I’d also say a few words here about the seasonality of the education labor market. I suspect everyone reading this intuitively understands that the American school system runs from the fall through the spring and (mostly) takes the summers off. Obviously there are some places with year-round calendars, some kids attend summer school, etc. But it’s a very cyclical industry, much more so than other sectors in the economy. I’m going to show you three graphs today to show you just how seasonal it is.
First up is a graph showing the raw, non seasonally adjusted employment figures in public K-12 education. Each line represents one calendar year. As you can see, there’s always a big summer drop off.
Even in a typical year, schools “lose” about 1.5 million employees from May to July, only to hire them all back in August, September, and October.
I put the word “lose” in quotes here, because these aren’t layoffs or retirements or even people quitting their jobs. It just reflects fewer people on school district payrolls as they have less need for hourly employees like bus drivers, substitute teachers, or cafeteria workers.
The red line is where we’re at in 2023. According to these non-seasonally adjusted numbers, we had more people employed in public schools in July 2023 than in any prior July since 2009.
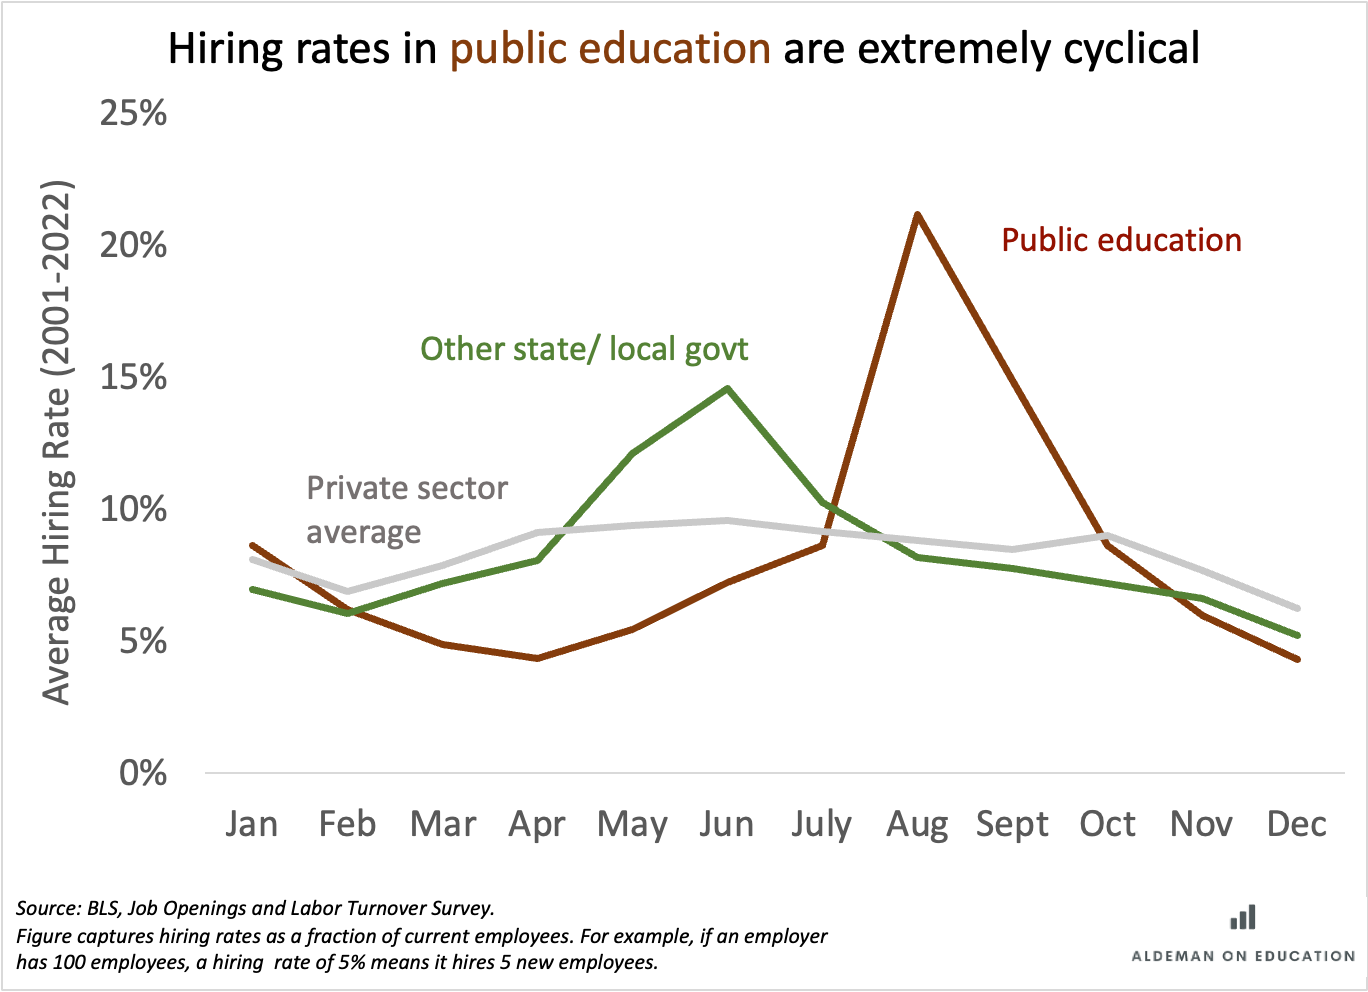
So education is seasonal, we get it. No, it’s actually more seasonal than other industries. The next chart comes from the same BLS data. But this time I’ve sorted it by hiring rates by month over the last two decades. The private sector (in light gray) is somewhat cyclical, and other state and local government agencies (in green) are slightly more so.
But public education (in red) is far more seasonal. It does very little hiring in the months of March and April as it scales down for summer. But that ramps back up as school starts back up again, and August is by far the biggest month of the year for school hiring.
At times it’s useful to look at the BLS’ seasonally adjusted figures for high-level comparisons. As I wrote in my piece for The74, those are still showing public K-12 employment is down from where it was pre-pandemic. The seasonally adjusted figures also consistently show that public education has lower employee churn than all other industries in the American economy.
But while that’s true on an annual basis, it’s not always true in certain months.
The last graph I’ll show you is what the latest month-by-month, non-seasonally adjusted hiring rates look like in public education versus the private sector. The private-sector (in light gray) is more volatile month to month, and the big surge in May and June of 2020 reflects a lot of businesses reopening after rapid COVID shutdowns.
But the non-seasonally adjusted numbers in education (in red below) show what’s really happening in schools. Each year, we see that big surge of hires as schools reopen in the fall.
In fact, you can see that hiring rates in public education were extremely elevated in August 2022, so much so that they briefly surpassed the hiring rate in the private sector. We don’t have the July, let alone the August, numbers for 2023 yet, but it’s safe to bet those hiring rates will once again be high.
Why does all this matter? Well, we’re in the middle of the biggest hiring month of the year for public education. Understanding what’s a normal part of the seasonal hiring cycle and what’s different about this year is important to truly understand the state of the education labor market.
Like these charts? Have other questions you’d like me to tackle? Leave comments or send me an email at chad-dot-aldeman-at-gmail.com.


