

Education Jobs Update, December 2025
Schools continue to hire, layoffs remain low, and turnover rates keep coming down

I was watching today’s jobs report with interest. Did the government shutdown, or the turmoil at the U.S. Department of Education, affect the state and local jobs numbers? The answer appears to be no. The fiscal cliff that I and many others predicted has not hit yet.
You could squint and see some trouble brewing for public higher education and other state government roles, but local government continues to grow. Across all of public education, job openings and hiring numbers remain strong, layoffs are historically low, and turnover rates continue to fall from their pandemic-era highs.
The latest jobs numbers show total employment through November of this year. Here are the year-over-year changes across sectors:
Public K-12: Up 1.0% (84,000 jobs)
Public higher ed: Down 1.3% (-33,000 jobs)
Private childcare services: Up 1.3% (14,000 jobs)
State government (non-education): Up 0.6% (17,000 jobs)
Local government (non-education): Up 1.1% (77,000 jobs)
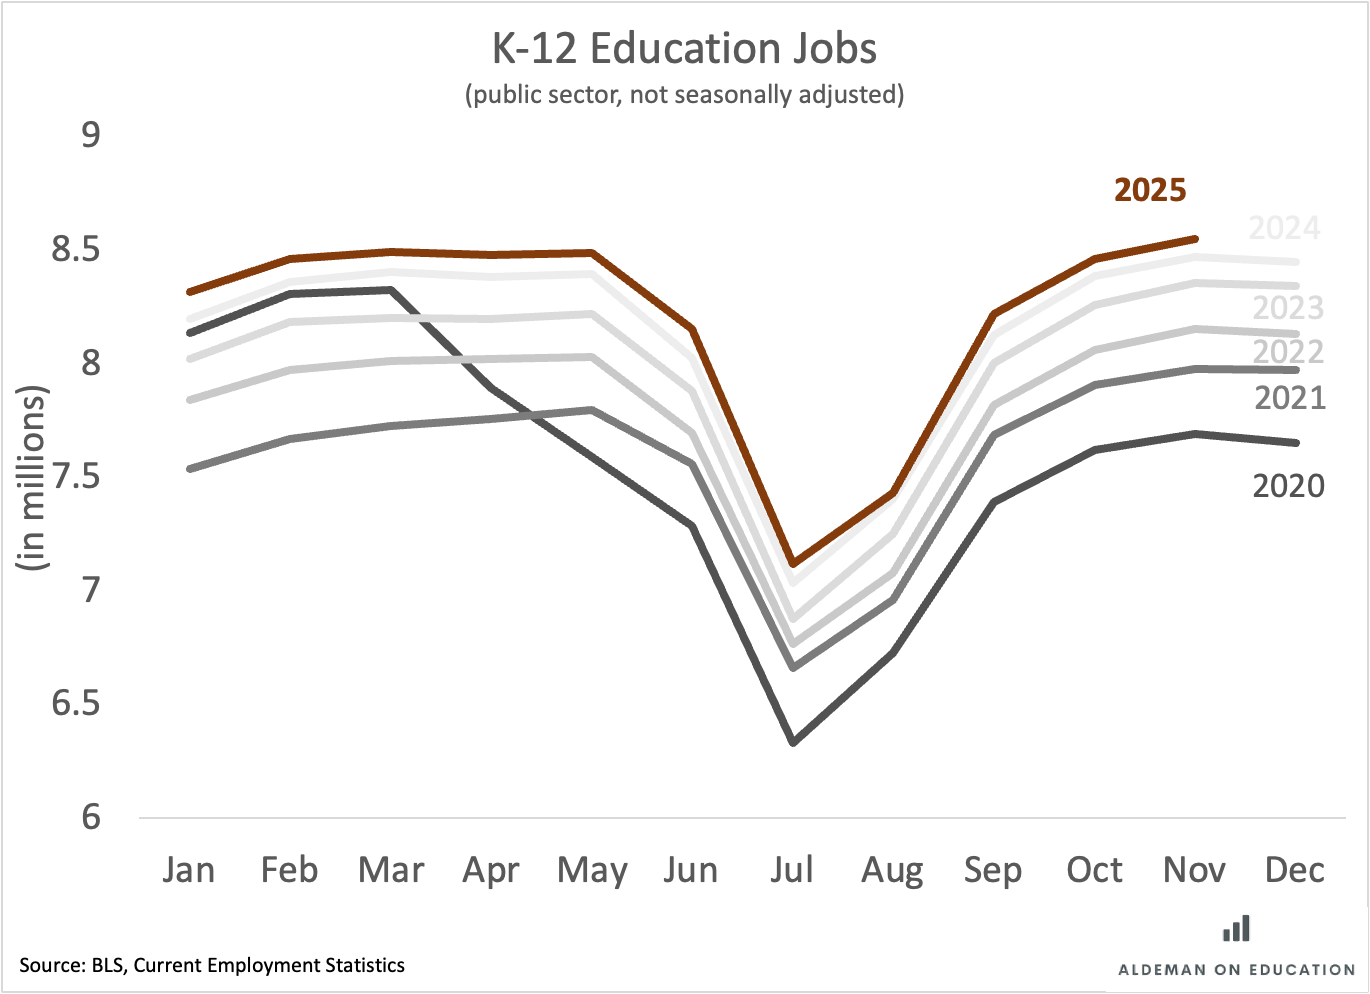
Because education is such a cyclical industry, one way I like to look at things is the non-seasonally adjusted numbers. The chart below breaks out the K-12 employment numbers by year. The dark black line is 2020. Things were chugging along normally until COVID hit in March, leading to an immediate drop in employment. The summer trough is always large in education, but when schools reopened virtually in the fall of 2020, they needed fewer part-time bus drivers and school custodians and lunchroom workers.
Ever since then, every year has been a bit higher than the year before it. Here we are in 2025 (the red line), and schools continue to add employees at a slow but steady clip.
I’ll keep watching these numbers closely in the coming months. Per my latest piece for The 74, districts can’t afford to continue to hold staff forever if they keep losing students, but for now everything looks relatively stable on the public-sector employment front.
Correlations Between Math and English Language Arts
In October I did a deep dive for The 74 and found that schools that do a good job teaching kids to read also do a good job in math.
I was reminded of that analysis as I was perusing Ohio’s Plan for K-12 Mathematics and came across this striking graph. See the very tight correlation between a districts’ performance in ELA and its performance in math:
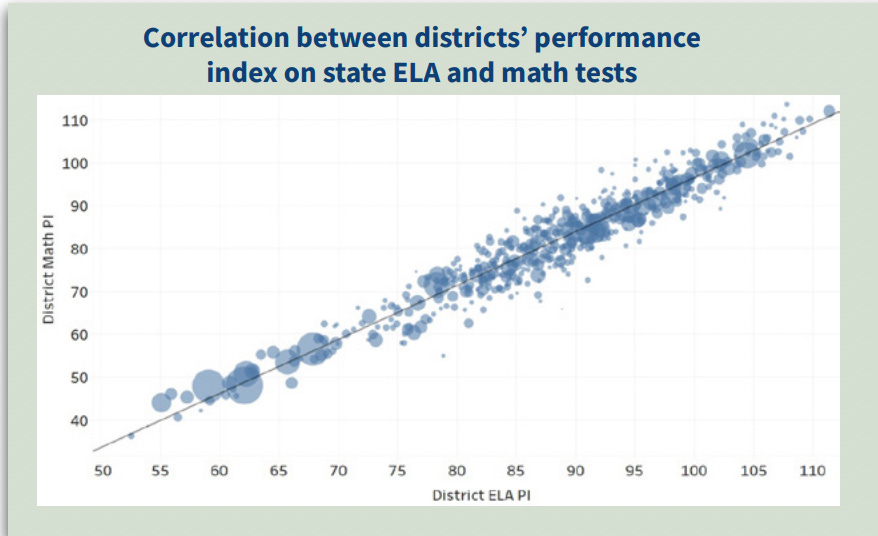
The authors note:
Recent analysis of state test data highlighted the strong and positive correlations between math and English language arts skills. The data showed that not only are students’ early math skills associated with their later math skills, even into high school, but that students’ proficiency in math and English language arts remained strongly correlated at every grade level. Of additional note, results revealed that kindergarten students who were on track for reading at grade level were 2.7 times more likely to be proficient in third grade math compared to their kindergarten peers who were not on track in reading. These odds progressively increased when considering first grade and second grade reading scores. Overall, data from Ohio’s state testing suggests that reading and math scores are correlated over time, and that early reading ability is an important factor to consider within the context of math instruction.
Reading List
Yours truly: Los Angeles Schools Have a $1.6B Structural Budget Deficit
James S. Murphy: What types of colleges lead to low earnings?
Tim Shanahan: What Teachers Need to Know about Sentence Comprehension
Josh Barro: Elite Colleges Should Try Harder to Stay Elite
Natalie Wexler: Teaching with Whole Books Boosts Comprehension and Engagement
There are two conclusions one could draw from the reading/math graph. One conclusion is that effective teaching of reading is correlated with effective teaching of math. The other conclusion is that test results are mostly the result of demographic effects, and demographic effects on math and reading are approximately equal. Do you have any data that can tease out the difference between those?
I'd imagine you could use something like that map you made for the 74, and look at the delta between predicted scores based on poverty level and the actual scores. Then see if outliers for reading are also likely to be outliers for math and vice versa.
Those reading/math numbers: math does involve reading skills the correlation should not be surprising, and, are the numbers different in high poverty schools? Also, take a look at the AFT magazine, American Educator, some interesting articles